

I write a weekly newsletter covering what I've found actually works with AI coding tools, Go, and building products. If you want the configs, costs and workflows I use daily, it's worth subscribing./p>
Join the newsletter - it's free
TL;DR: A key part of Rules Engine is ensuring efficient data access and processing during back tests. By moving away from JSON and using gob instead, I made an 84x improvement on reads, and a 20x improvement on writes.
Core to Rules Engine functionality is the back test. The way a single stock back test works is as follows:
- A rule is created with N entry and N exit criteria
- The period for the back test is set. This ranges from 1 day to 5 years (~1,300 days)
- The rule is run from the earliest date through to the current date
- For each date run, each criteria is checked to see if the criteria is met
- If all entry criteria are met for a single day, a trade is opened (if there is not already a trade open)
- If all exit criteria are met or if the stop loss is triggered, any open trade is closed
The criteria object can be quite complex. By way of example we'll illustrate various levels of complexity:
- If the price is more than $100 over a single day
- If the price increases by 5% over two days
- If the price increases continuously for five days
For each of these criteria, the price has to be retrieved for the number of values that are requested (one, two and five) and the criteria checked. This happens for every day in a given back test.
The importance of caching
Due to the number of reads for a given set of data, likely price or volume, I have implemented multiple levels of caching to ensure efficient data retrieval.
For every data request (each criteria), the flow goes as follows:
- Ask the repository function for N records of data
- If N is greater than the default cached number of records*, get them straight from the database
- If N is less than the default cached number of records, check the cache
- First, we check in-memory cache and respond with the required subset of records (N records offset by the back test day)
- If these are not in memory, we check redis (again, N records offset by the back test day)
- In the event that N is less than the default number of cached records and it is not stored in either cache, we cache both redis and in-memory for subsequent requests
*This number depends on the usage of the platform. Most back tests run are for under 6 months so 200 would cover this, if longer back tests are run this number can be increased.
In-memory caching works well as each back test for a single stock runs on a single instance. The memory is released (the in-memory cache is deleted for the given stock/cryptocurrency) at the end of the back test to ensure we don't continually allocate memory.
As the records being cached are a slice of structs, I was using JSON to Marshal and Unmarshal the records accordingly. Performance was decent, but I felt like it was still too slow. After going through the application flow I couldn't find any big efficiency gains, so decided to do a pprof and see what was going on under the hood.
pprof to the rescue
One of the biggest reasons I love Go is the tooling. All I had to do was expose the production cluster locally, run the back test query, run the pprof command against the local ports, and take a look at the output. I was mainly interested in CPU usage in this instance.
The initial results clearly showed where efficiency gains were to be found:
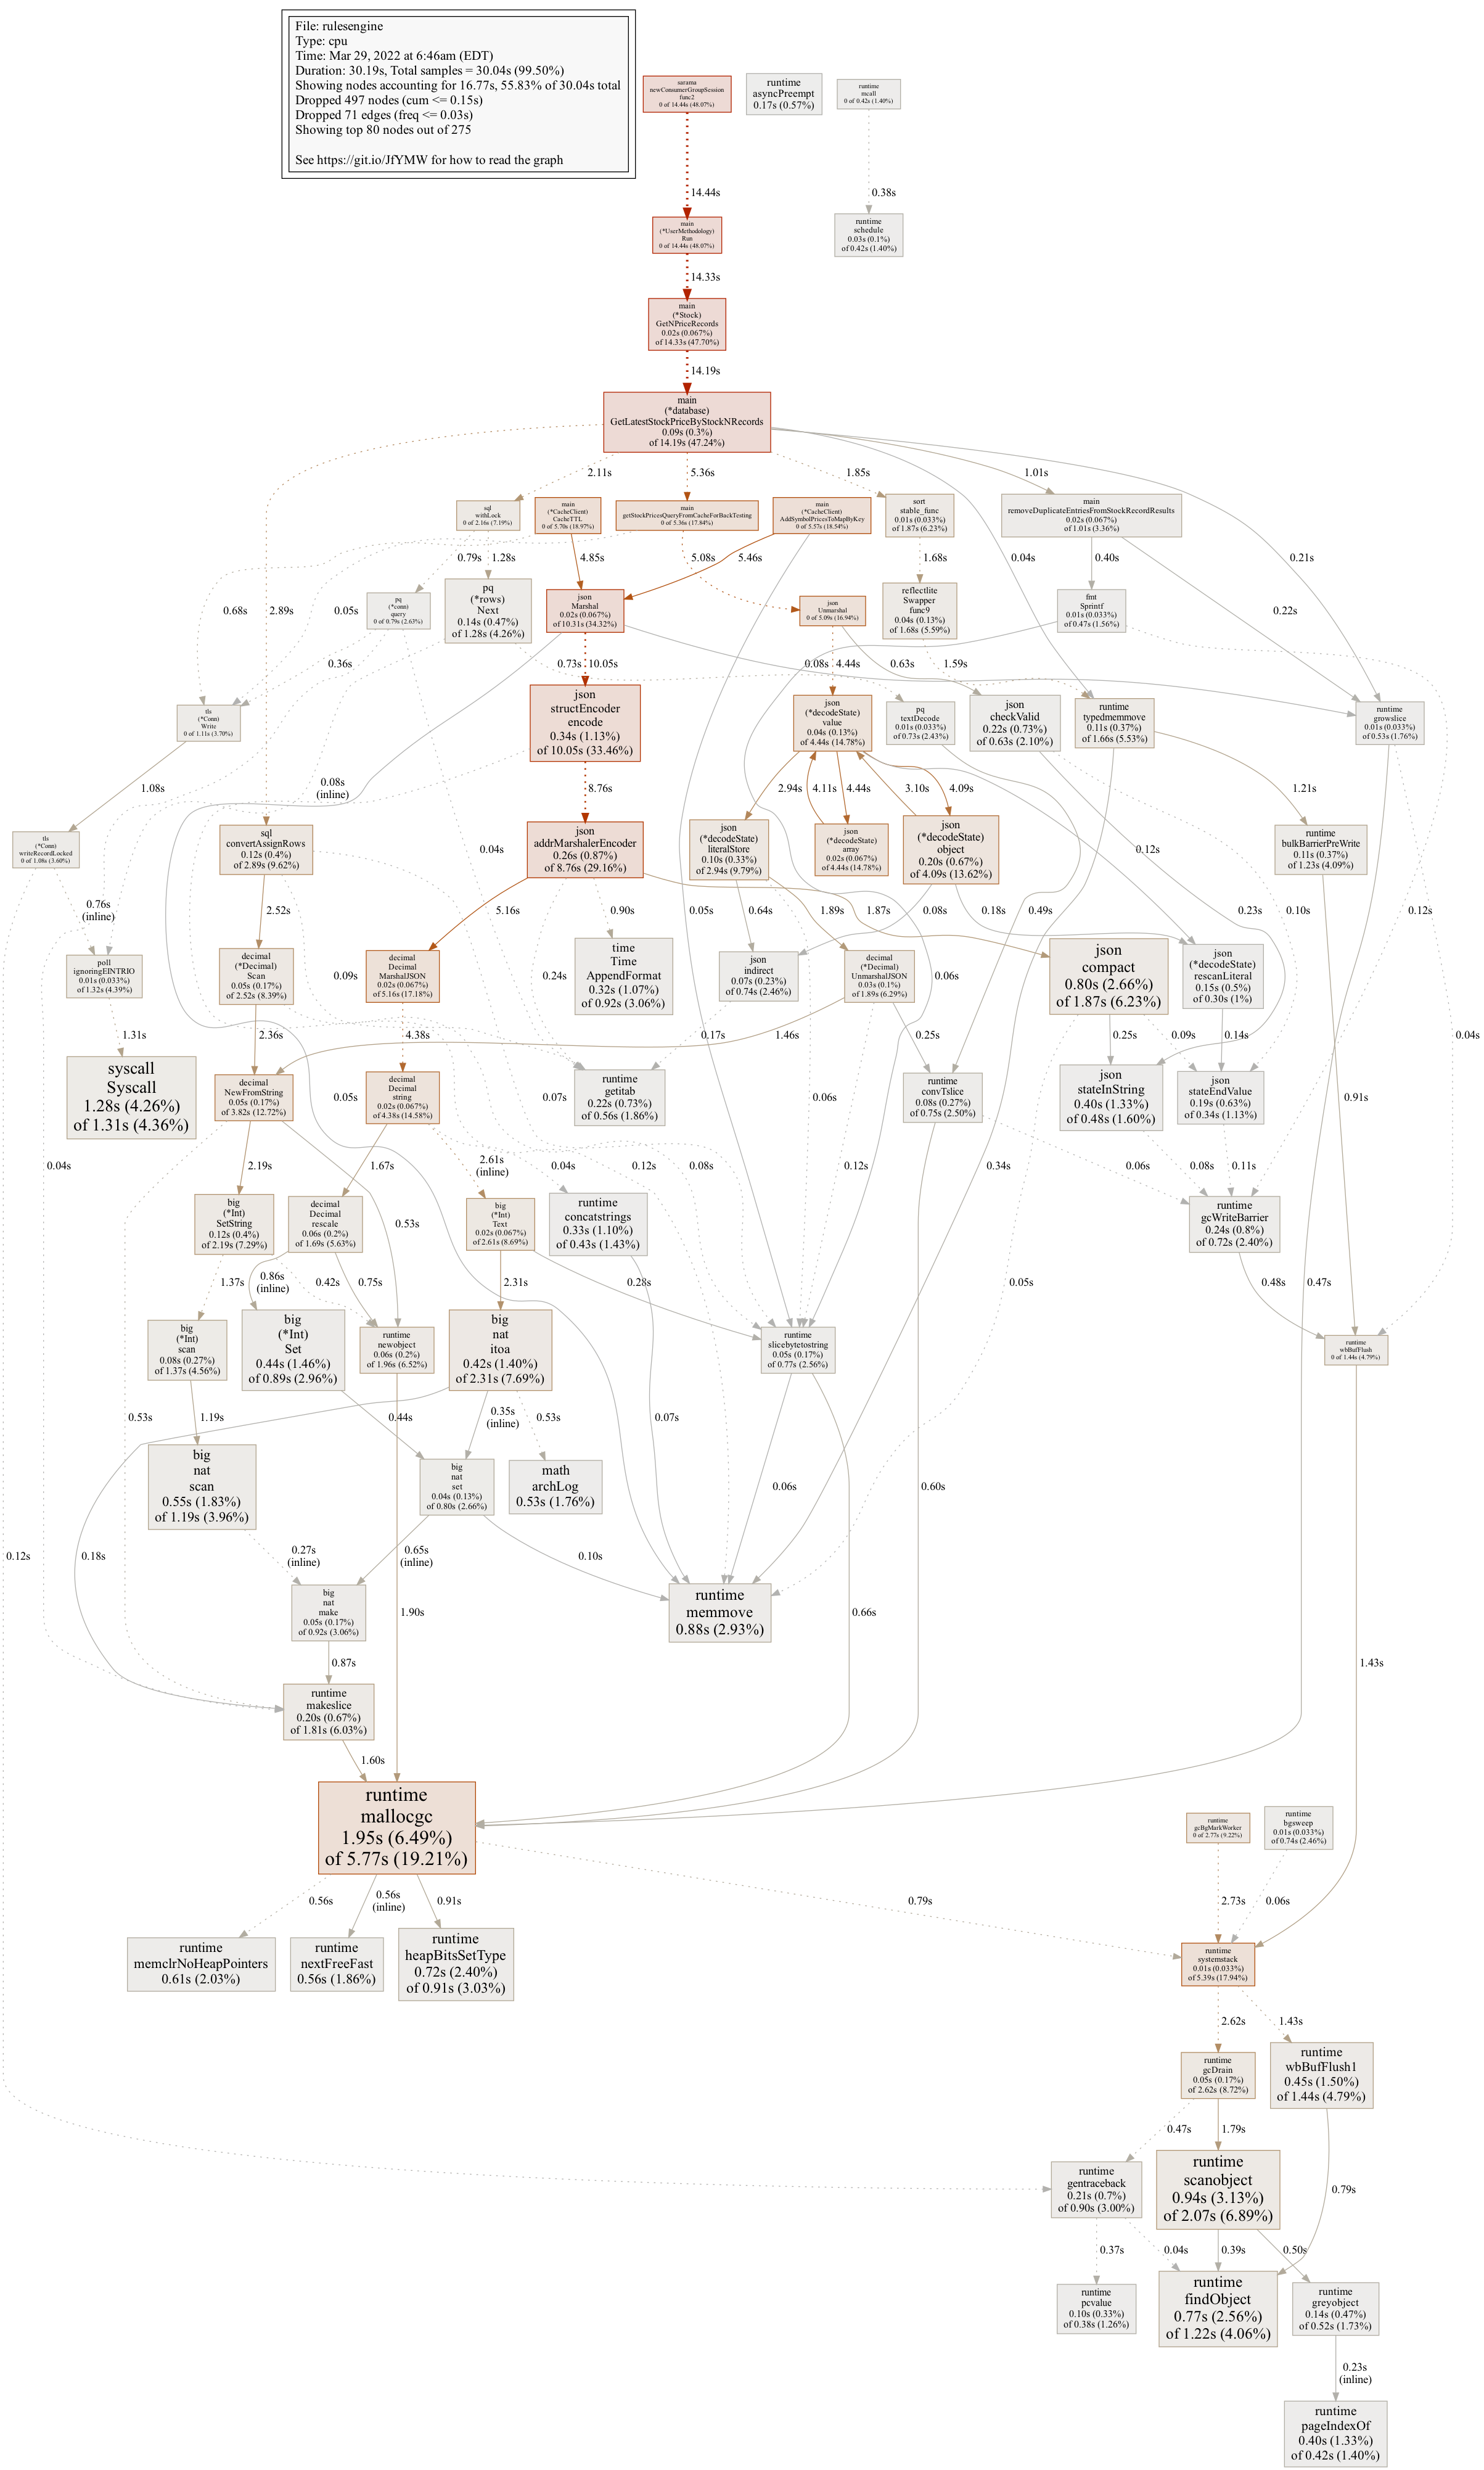
As seen above, there are a three main areas that come up as focal points:
- JSON read
- JSON write
- Garbage Collection
After a quick search, gob seemed to be the obvious choice for a replacement. It's binary based, works super well with structs, and the caching didn't need to be human-readable.
Due to the application design I'd implemented this was a very quick change - around four pieces of code in the cache.go file.
The code change was broadly as follows:
// Using JSON
err = json.Unmarshal(obj, result)
if err != nil {
	return
}

// Using gob
buf := bytes.NewBuffer(obj)
dec := gob.NewDecoder(buf)
err = dec.Decode(&result)
if err != nil {
	return
}
This was done for the get/delete/fetch functions for both redis as well as the internal mapping.
I ran my test suite, deployed locally and tested, and then pushed to production. I re-ran the same back test and got the following pprof:
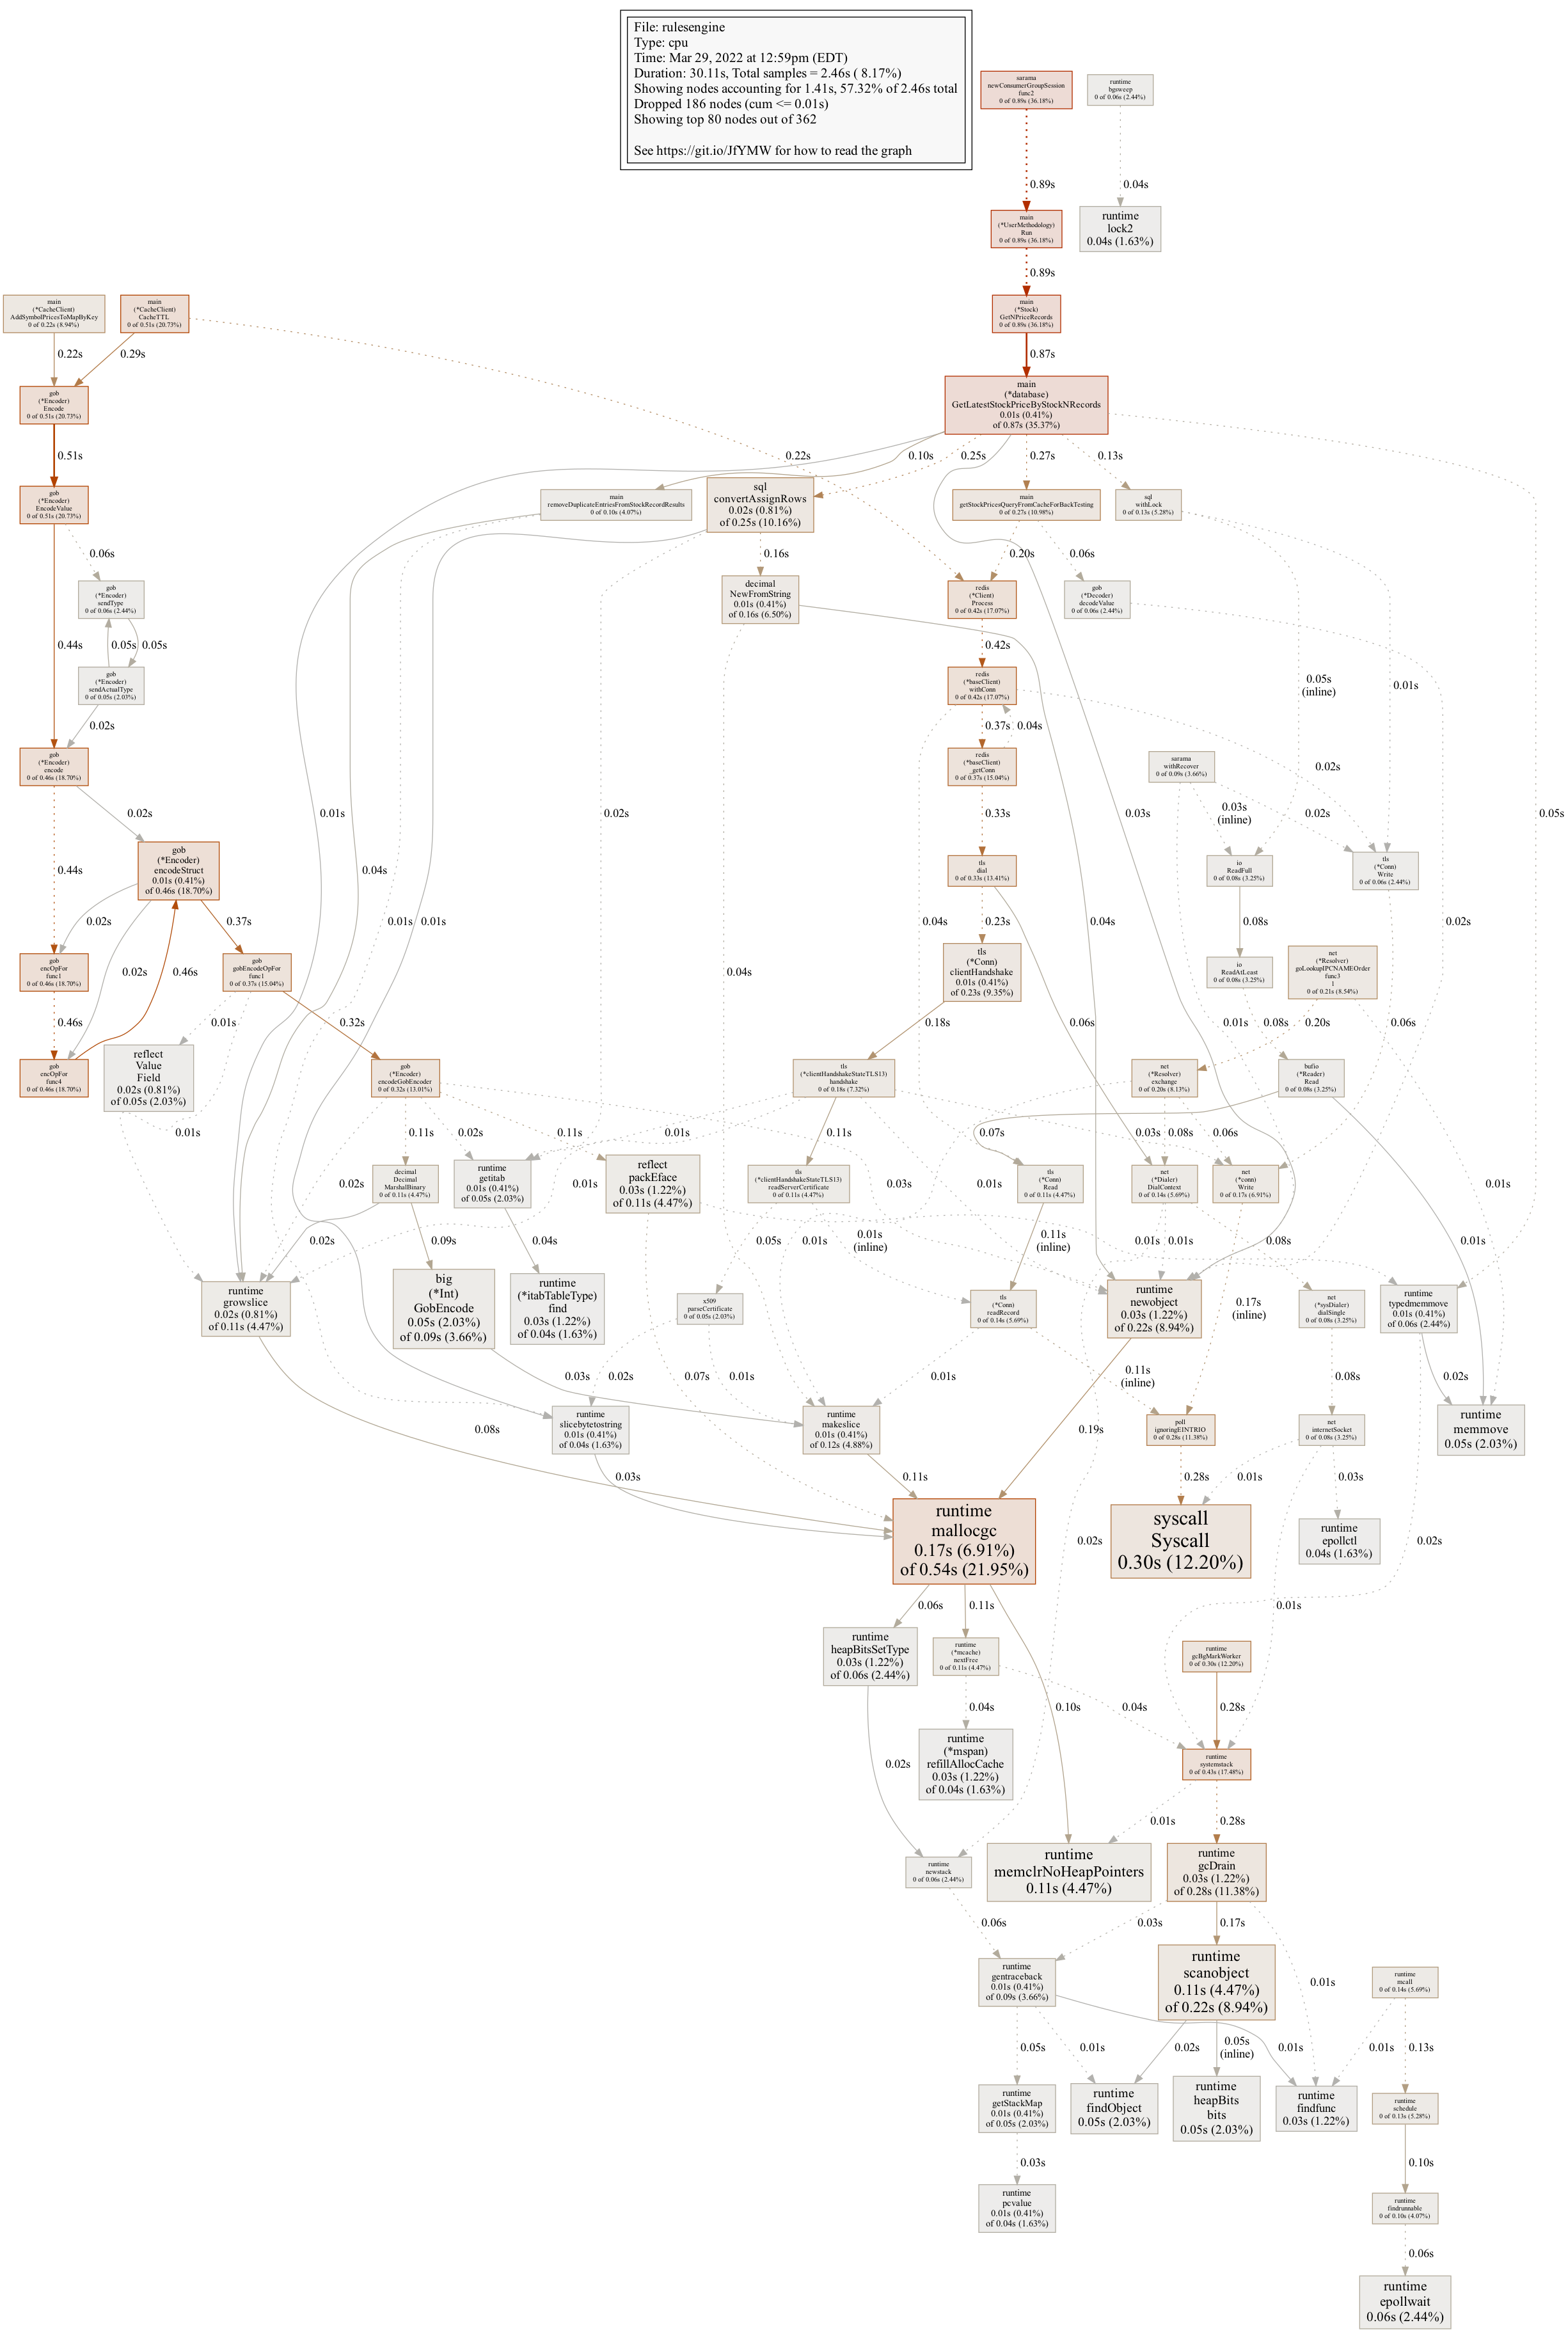
I also made the garbage collector a little less aggressive. As seen above, the time spent on encoding and decoding is drastically reduced, so much so that even finding the gob.Decoder is a challenge (in the middle, to the right).
Results
At a high level, we can see the following. The profile time totalled 31s for both.
- Time spent on JSON write (Marshal): 10.31s
- Time spent on JSON read (Unmarshal): 5.09s
gob shows some significant gains:
- Time spent on gob write (Encode): 0.51s
- Time spent on gob read (Decode): 0.06s
So, in summary, we have the following results:
- Writes became 20.2x faster
- Reads became 84.8x faster
As a reminder - the same queries were run for both of these tests, no other queries were being run at the time, and the same cluster/hardware was used.
This translates to a 3 criteria rule taking ~1.5s for a one month back test, and ~10s for a 1 year back test. This is lightning fast if you know all of the logic going on under the hood.
Lesson
I'll be moving all caching that doesn't require to be read by a frontend to gob, or if for some reason it needs to be human-readable (and you cannot convert the data before reading). The times JSON shines is when it needs to be parsed by a javascript application. Fortunately, this is pretty rare as most of the frontend's data need are served by the API.
Why not protobuf?
Three reasons: this is now fast enough, gob is in the standard library, and protobuf requires some pre-compilation which adds overhead. I'm chasing simplicity as well as efficiency, and using gob gives more than enough speed for the use case as it stands now. If we hit scaling issues in this part of the code, we will be taking a look at protobuf then, but for now everything is flying and focus is on other topics.