Before we dive in: I share practical insights like this weekly. Join developers and founders getting my newsletter with real solutions to engineering and business challenges.
I've had this problem for ages now. Close my MacBook Pro at 60%, open it the next day - flat. Sometimes 30% gone overnight doing absolutely nothing. It's the most frustrating thing, especially when I know my M-series MacBook Air at work barely loses a percent.
My 2020 Intel MacBook Pro has been the culprit, and I've tried everything. Activity Monitor tells me nothing useful about what happens while the lid is closed. The built-in battery settings are vague at best. I thought I'd fixed this months ago by disabling Power Nap, but clearly something changed or I was wrong.
So I did what I always do when a tool doesn't exist - I built one.

The Real Problem: Dark Wakes
Here's what I discovered that most people don't know about: your Mac doesn't just sleep and wake. There's a third state called a "dark wake" where macOS briefly wakes the CPU without turning on the display.
This happens constantly throughout the night for things like push notifications from Mail or Messages, background app refresh, Power Nap features like Time Machine backups and iCloud sync, network maintenance like DHCP renewal, and Bluetooth device wake requests. Every single one of these prevents your CPU from entering deep sleep states.
A Mac with 50 dark wakes overnight drains significantly more battery than one with 2. Each wake pulls the CPU out of its deepest power-saving C-states, and the transition itself consumes energy. If your Mac is waking every few minutes to check for notifications or sync files, it never reaches the idle power levels that give you all-day battery life.
The problem is that macOS gives you no easy way to see this happening. You can dig through pmset -g log output manually, but it's a wall of text with timestamps and cryptic reason codes. Good luck correlating that with battery drain or figuring out which app triggered each wake. Activity Monitor only shows what's happening right now, not what happened at 3am while you were asleep.
I built Power Patrol to answer the questions I actually cared about: what's consuming my battery right now, why does my Mac drain while sleeping, and which processes are preventing proper sleep states?
What Power Patrol Does
At its core, Power Patrol is a daemon that continuously collects power metrics and generates reports about what's happening on your Mac. It runs six parallel collectors gathering data from different macOS subsystems, stores everything in SQLite, and serves it up through a real-time web dashboard.
The sleep drain analysis is the killer feature. It detects dark wakes and identifies the exact processes preventing proper sleep by tracking power assertions - basically apps telling macOS "don't sleep yet, I'm doing something important." It correlates battery levels at sleep and wake times to calculate drain per hour, then provides an assessment. Normal is under 1% per hour, high is 1-3%, and anything above 3% is critical and needs investigating.
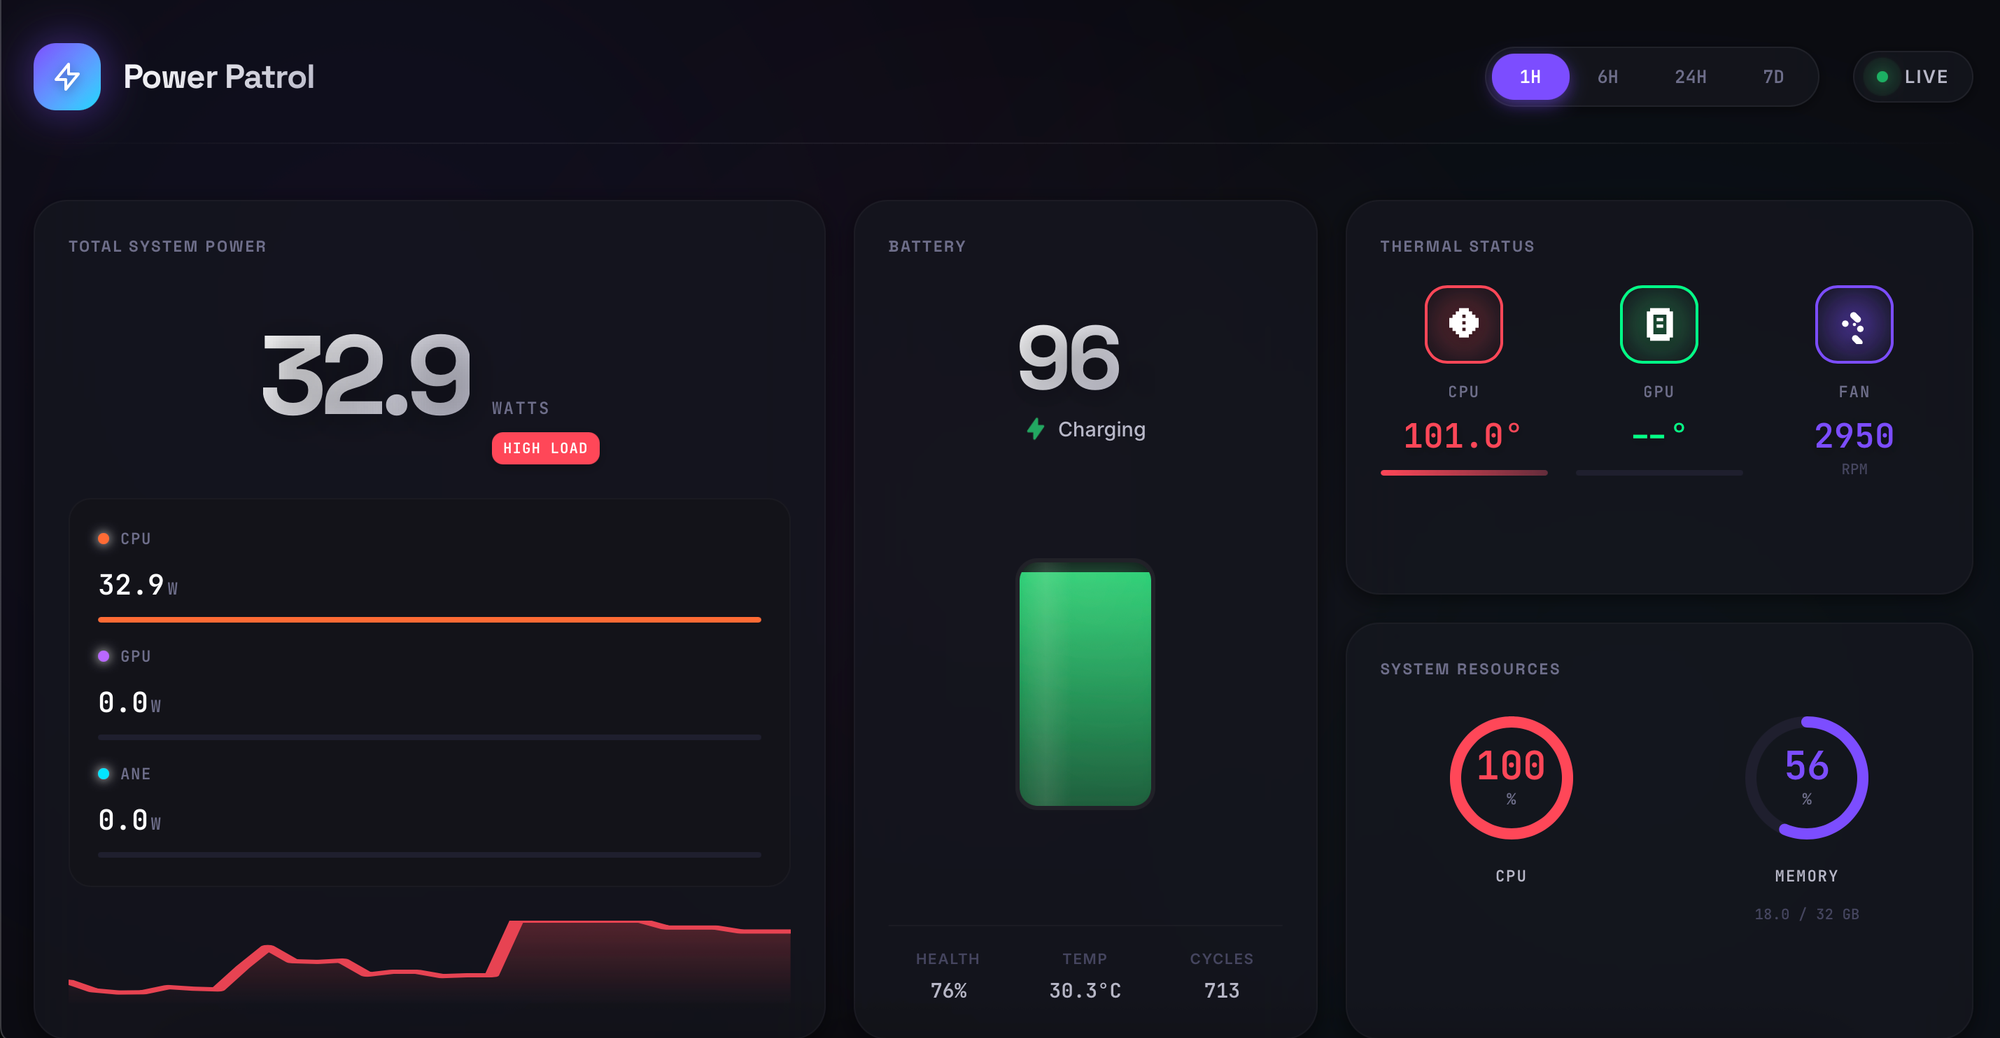
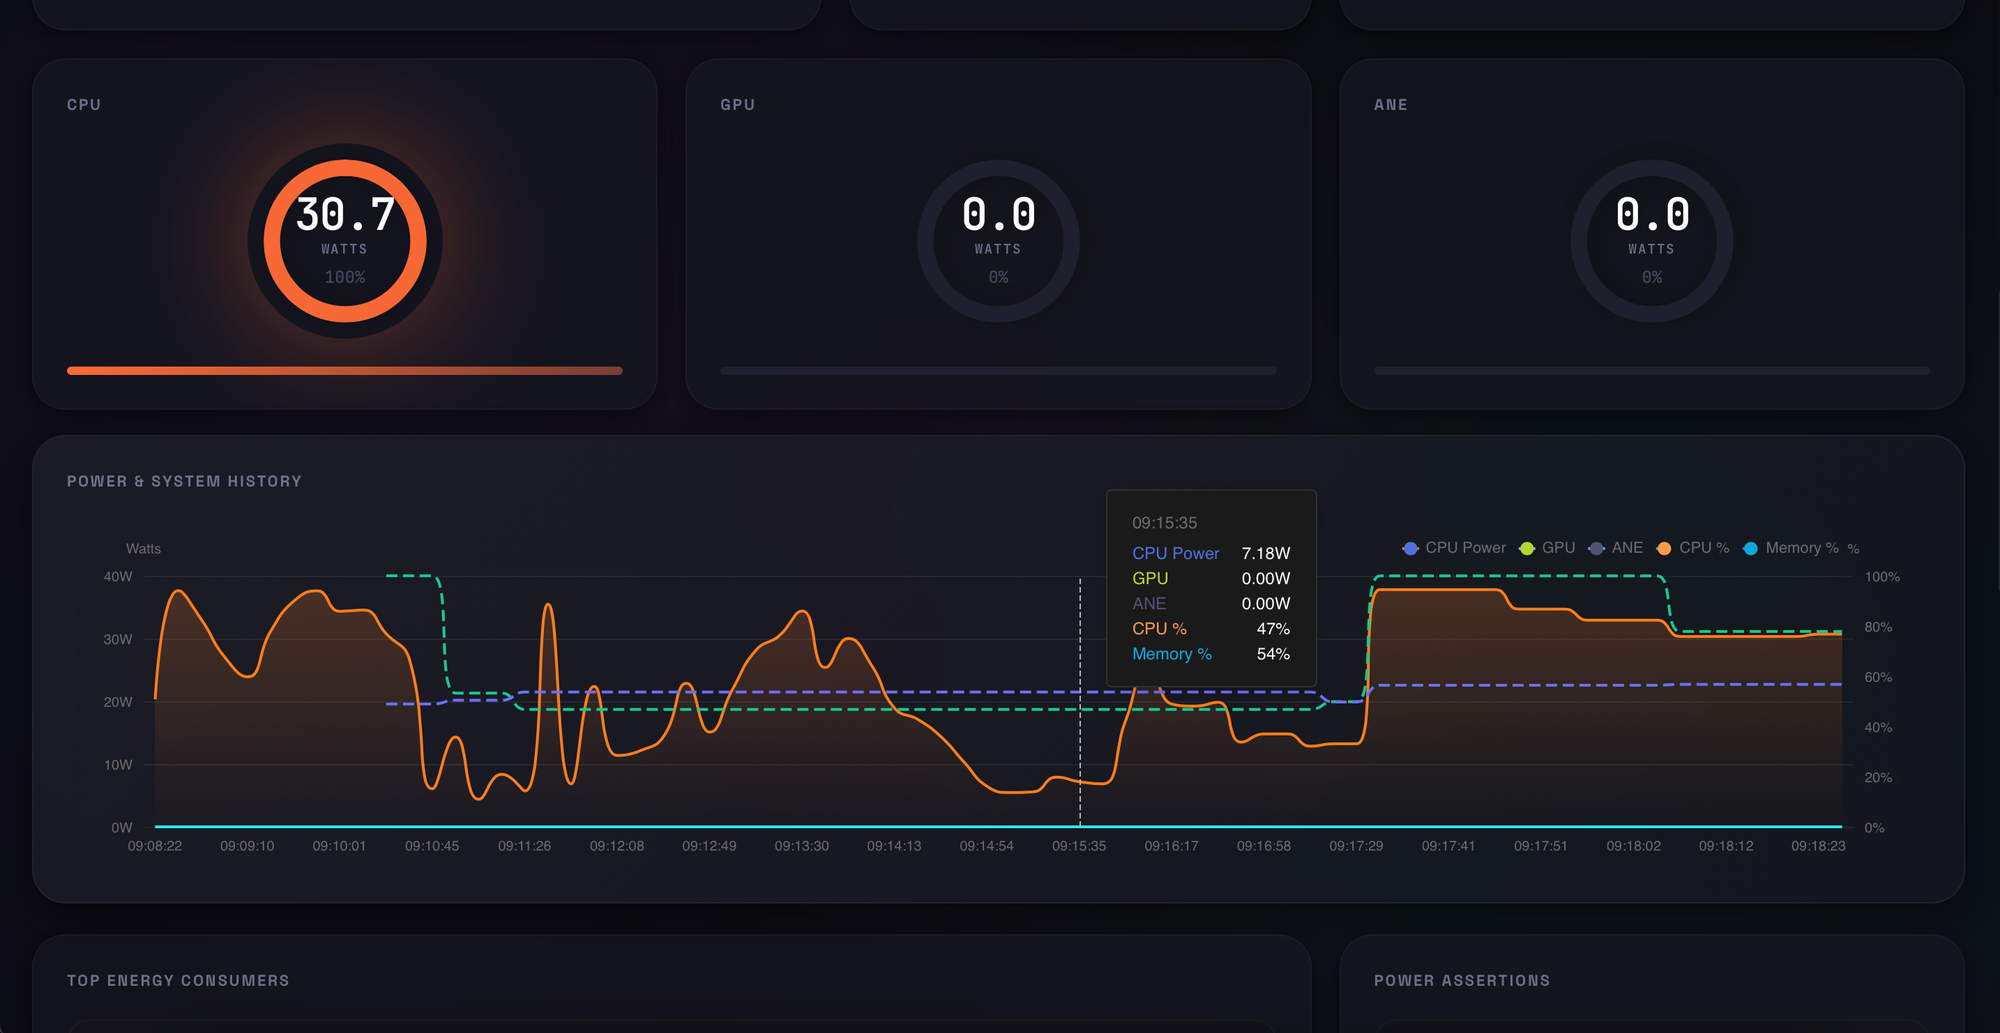
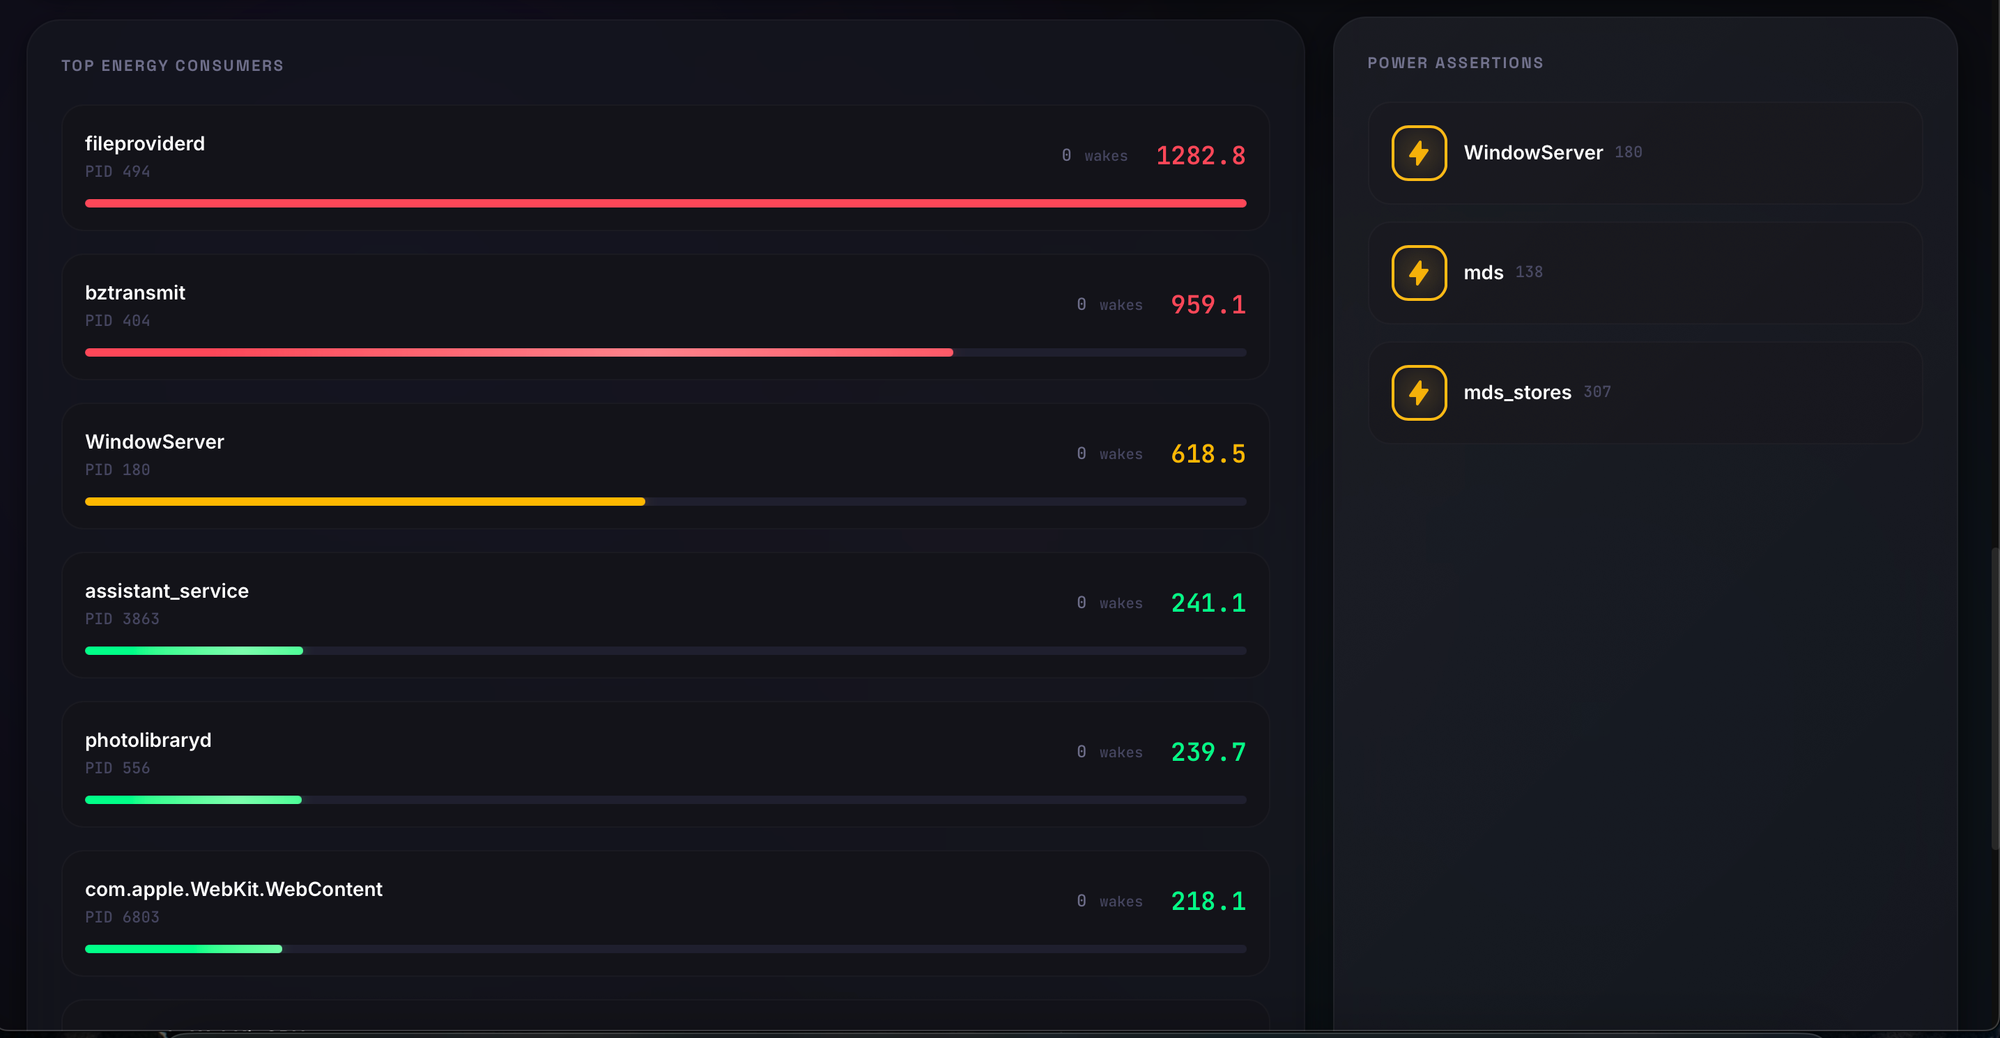
The real-time monitoring shows CPU, GPU, and ANE wattage, per-process energy consumption ranked by impact, thermal data including fan speed and throttling, and a list of active power assertions. The dashboard updates via WebSocket with under 5 seconds of latency, so you can watch in real time as you open apps and see their power impact.
Process identification tells you not just that something is draining your battery, but exactly which app is holding a power assertion and what type. Spotify might be preventing idle sleep with a PreventUserIdleSystemSleep assertion. Backblaze might be running BackgroundTask assertions to sync files. Docker might be keeping the network alive. Knowing the assertion type helps you understand whether to quit the app or just configure it differently.


The Architecture
I wanted this to be robust enough to run continuously as a daemon while being simple enough to understand and debug. The system uses a fan-out/fan-in architecture with Go's errgroup for lifecycle management.
The central orchestrator manages six independent collectors, each responsible for one data source. There are typed channels for each data flow - power samples, process energy, battery status, thermal status, system stats, power assertions, and sleep/wake events. This separation means each collector can fail independently without bringing down the others, and the channel buffering absorbs temporary slowdowns.
All collectors run as independent goroutines coordinated by golang.org/x/sync/errgroup. Each has its own sampling interval based on how quickly that data changes. Power metrics sample every 5 seconds because wattage fluctuates rapidly. Battery status only needs checking every 30 seconds since charge percentage doesn't change that fast. Sleep/wake events get polled every 5 minutes since they're relatively rare.
The key design choice is that if any collector fails fatally, errgroup cancels the shared context, triggering graceful shutdown of all others. But collectors are designed to be resilient - a single failed sample logs a warning and continues. Only persistent failures trigger shutdown.
All channels have a buffer of 100 with non-blocking sends. At 5-second sampling, this gives roughly 8 minutes of buffering before data loss. If the data processor falls behind, collectors drop samples rather than blocking. This ensures sampling intervals stay consistent even under load - missing a few samples is better than skewing the timing of everything.
Talking to macOS Power APIs
The interesting part is how you actually get power data from macOS. There's no nice API for this - you have to shell out to Apple's command-line tools and parse their output.
For power metrics, I use powermetrics, Apple's official tool for hardware power data. You ask it for a single sample in plist format with specific samplers for CPU power, GPU power, and per-task energy. The output comes as a binary plist, which is where things get annoying.
Different macOS versions have different plist structures. Sequoia changed some field names from Ventura. Rather than rigid struct unmarshalling that breaks with every macOS update, I parse into a map and extract what exists. The code tries multiple field names for the same data - cpu_watts first, then cpu_power as a fallback. This makes the collector resilient to Apple's changes.
For the energy impact calculation that mimics Activity Monitor, the formula is roughly CPU time plus weighted idle wakeups. Idle wakeups get penalised because they prevent deep CPU sleep states - an app that wakes the CPU frequently is worse than one that uses CPU continuously.
There's also a streaming mode that keeps powermetrics running continuously rather than spawning it for each sample. This has lower overhead but is trickier to manage - powermetrics outputs NUL-separated plist documents, so you need a custom scanner split function to parse them. I use the polling approach for simplicity.
For sleep/wake events and power assertions, I parse output from pmset. The -g assertions flag shows what's currently preventing sleep. The -g log flag shows the history of sleep transitions. Both require regex parsing to extract the structured data from human-readable output.
The distinction between "Wake" and "DarkWake" in the logs is crucial. A log entry showing DarkWake from Deep Idle [CDNP] : due to EC.ACDetach becomes a dark wake event with the reason captured. Over a sleep session, I count these up and correlate them with battery drain to understand the impact.
The Sleep Analysis Flow
When Power Patrol detects a wake event, it triggers analysis automatically. The flow reconstructs what happened during sleep and identifies who's responsible.
First, it finds matching sleep-wake pairs from the event log. You need to walk backwards from the wake event to find its corresponding sleep event, accounting for the fact that there might be multiple dark wakes in between. The sleep session spans from the sleep event to the final wake event, with any dark wakes counted as interruptions within that session.
Then it correlates battery levels. Battery samples aren't recorded exactly at sleep and wake moments - they're on their own 30-second interval. So there's a ±5 minute tolerance to find the nearest sample. The code searches recent battery history and picks the sample with the smallest time difference from the target timestamp. This tolerance handles timing mismatches without sacrificing accuracy.
The drain calculation is straightforward once you have the battery levels - just the percentage difference divided by the duration in hours. The assessment thresholds came from experimentation and reading what others consider normal. Under 1% per hour is fine for an Intel Mac. Between 1-3% suggests something is keeping the system partially awake. Above 3% means something is seriously wrong.
Culprit identification queries power assertions that were active during the sleep period. The collector samples assertions every 30 seconds, so there's a record of what was running. By filtering to assertions that overlap with the sleep window, you get a list of processes that were potentially preventing deep sleep. Each assertion has a type that explains why - PreventUserIdleSystemSleep for media apps, BackgroundTask for sync services, NoIdleSleepAssertion for remote desktop apps.
The final report brings it all together: sleep duration, battery drain percentage, drain per hour, assessment, the list of culprits with their assertion types, and all dark wake events with their reasons. You can see at a glance whether your Mac had a restful night or was constantly being poked awake.
Embedding Vue in the Go Binary
The frontend is built with Vue 3, TypeScript, and ECharts for the real-time graphs. But rather than deploying it separately and dealing with CORS and nginx configuration, I embedded the entire compiled Vue app into the Go binary.
Go 1.16 introduced the embed package, which lets you include files in your binary at compile time. The build pipeline works like this: first npm runs the Vue build, which does TypeScript checking and then Vite bundling to produce a dist folder with index.html and hashed asset files. Then the Makefile copies that dist folder to a location next to the Go server code. Finally, the Go build uses an embed directive to pull those files into the binary.
The embed directive references a static directory relative to the Go source file. At compile time, Go reads all the files, compresses them, and makes them accessible via an embedded filesystem variable. The resulting binary contains all the Vue assets as compressed data alongside the compiled Go code.
Serving the embedded files requires a small trick for single-page app routing. Vue Router uses client-side routing, so URLs like /dashboard don't have corresponding files - they're handled by JavaScript. If someone bookmarks that URL and refreshes, the server would normally return 404. The solution is to check if a requested path matches a real embedded file, and if not, serve index.html instead. Vue's router then handles the path client-side.
There's also graceful degradation. If the frontend wasn't built, the embedded filesystem returns an error. Rather than crash, the server switches to API-only mode and serves a simple HTML page explaining how to build the frontend. This means you can always run the Go binary even during development when you might not have the Vue build.
The advantages of this approach are significant for a tool like Power Patrol. Single artifact deployment - you copy one file, not a directory structure. No CORS configuration since everything is same-origin. Atomic updates where a new binary means new frontend and backend together. And it works completely offline since the binary contains everything.
The main tradeoff is that any frontend change requires a full rebuild. During development I run Vite's dev server separately with hot reload, and it proxies API calls to the Go backend. For production, everything gets bundled together.
What I've Found So Far
Running Power Patrol on my MacBook Pro, I'm narrowing down the culprits. Backblaze seems to be one - it holds background task assertions to sync files even when the lid is closed. This makes sense from Backblaze's perspective since they want your backups to stay current, but it's terrible for battery life on a laptop that's meant to be sleeping.
There's also something network-related causing dark wakes, possibly triggered by another app trying to maintain a connection. Docker is a suspect since it needs to maintain container networks and might be responding to health checks. Cursor and other Electron-based IDEs often keep background processes running that could be requesting wake events for sync or telemetry.
The interesting pattern I've noticed is that dark wakes tend to cluster. You'll have a quiet period, then suddenly three wakes in ten minutes, then quiet again. This suggests apps are triggering chains of activity - one wake leads to network traffic, which triggers another app to respond, and so on. Understanding these chains is the next thing I want to investigate.
What's been satisfying is having concrete data instead of guessing. I can close the lid at night, check the sleep report in the morning, and see exactly what happened. Last Tuesday: 7 hours of sleep, 6% drain, drain rate of 0.86% per hour, assessment normal, 4 dark wakes. That's acceptable. Last Friday: 6 hours of sleep, 18% drain, drain rate of 3% per hour, assessment critical, 23 dark wakes with Backblaze holding assertions for most of them. Now I know where to look.
Tech Stack
Backend is Go with Gorilla for routing and WebSockets, SQLite in WAL mode for storage, and zerolog for logging. Frontend is Vue 3 with TypeScript, Vite, ECharts, TailwindCSS, and Pinia for state management. The whole thing compiles to a single binary around 50MB including the SQLite driver and embedded frontend.
I used the frontend design skill from Claude Code for the dashboard design. Having a consistent visual style without spending hours on CSS was a nice productivity boost.
What's Next
I'm using powerPatrol daily now and will open source it soon. The core functionality works well, but I want to polish the installation process and add proper documentation before releasing it.
If you're dealing with mysterious battery drain on your Mac, especially an Intel machine, the key things to investigate are power assertions and dark wakes. Even without powerPatrol, you can check some of this manually with pmset -g assertions to see what's currently preventing sleep and pmset -g log | grep -E "(Sleep|Wake|DarkWake)" to see recent sleep transitions.
But having it all in one place with historical data and automatic analysis is what makes the difference between knowing there's a problem and actually solving it.
I've written before about building local HTTP servers in Go which covers some of the API server patterns used here. The collector architecture shares ideas with mocking Redis and Kafka in Go around channel-based communication and graceful shutdown. For the deployment side, why I reach for Ansible on every project covers how I'd set up powerPatrol as a proper system daemon.


