

I write a weekly newsletter covering what I've found actually works with AI coding tools, Go, and building products. If you want the configs, costs and workflows I use daily, it's worth subscribing./p>
Join the newsletter - it's free
I've been working on quite a large codebase recently, and my development workflow has evolved to rely heavily on Claude Code. The problem is, when you're juggling multiple complex tasks simultaneously, you end up with sessions scattered across different terminal tabs and directories, and frankly, it becomes impossible to keep track of what's what.
Here's a practical example of my typical day: I'll have one work tree checked out for improving test coverage, another for debugging a particularly tricky issue that's been causing problems for days, and a third for knocking out smaller issues as they come up. Each of these needs its own Claude session, and I'll often cycle through them throughout the day. The small issue work tree might see three or four different sessions as I tackle quick fixes, while the debugging session might run for 30 hours straight as I dig into really complex edge cases.
The challenge became clear when I realised I was spending time hunting for sessions than actually working in them. I'd open a new terminal tab, navigate to what I thought was the right directory, only to discover Claude wasn't running there. Or I'd find a session that had been churning away for hours on something I'd completely forgotten about. There had to be a better way to get visibility into what was actually happening.
The Missing Piece in My Workflow
I'd already built CC Switch, a tool that makes it easy to manage different workflows for the same repository using Git Work Trees. This solved the problem of context switching between different branches and features, but it didn't address the Claude session management piece. I needed something that could give me a real-time view of all my active sessions, what they were working on, and crucially, how much they were costing me.
The cost aspect became particularly interesting after I moved to the Claude Pro Max plan at $200 per month. I was curious whether I was actually saving money compared to API usage. The answer was frankly shocking - I regularly spend more than $200 a day, or would if I was using the API. This happens at least four days a week, most weeks five days a week. I honestly don't know how Anthropic is making money on the Max plan, but I'm not complaining.
There's a CLI tool called CC Usage that provides some insights, but I wanted something more comprehensive. Real-time graphs showing token usage over time, session-by-session breakdowns, and automatic updates without having to remember to check. Most importantly, I wanted to see this information at a glance without having to context switch away from my actual work.
Building the Claude Session Manager
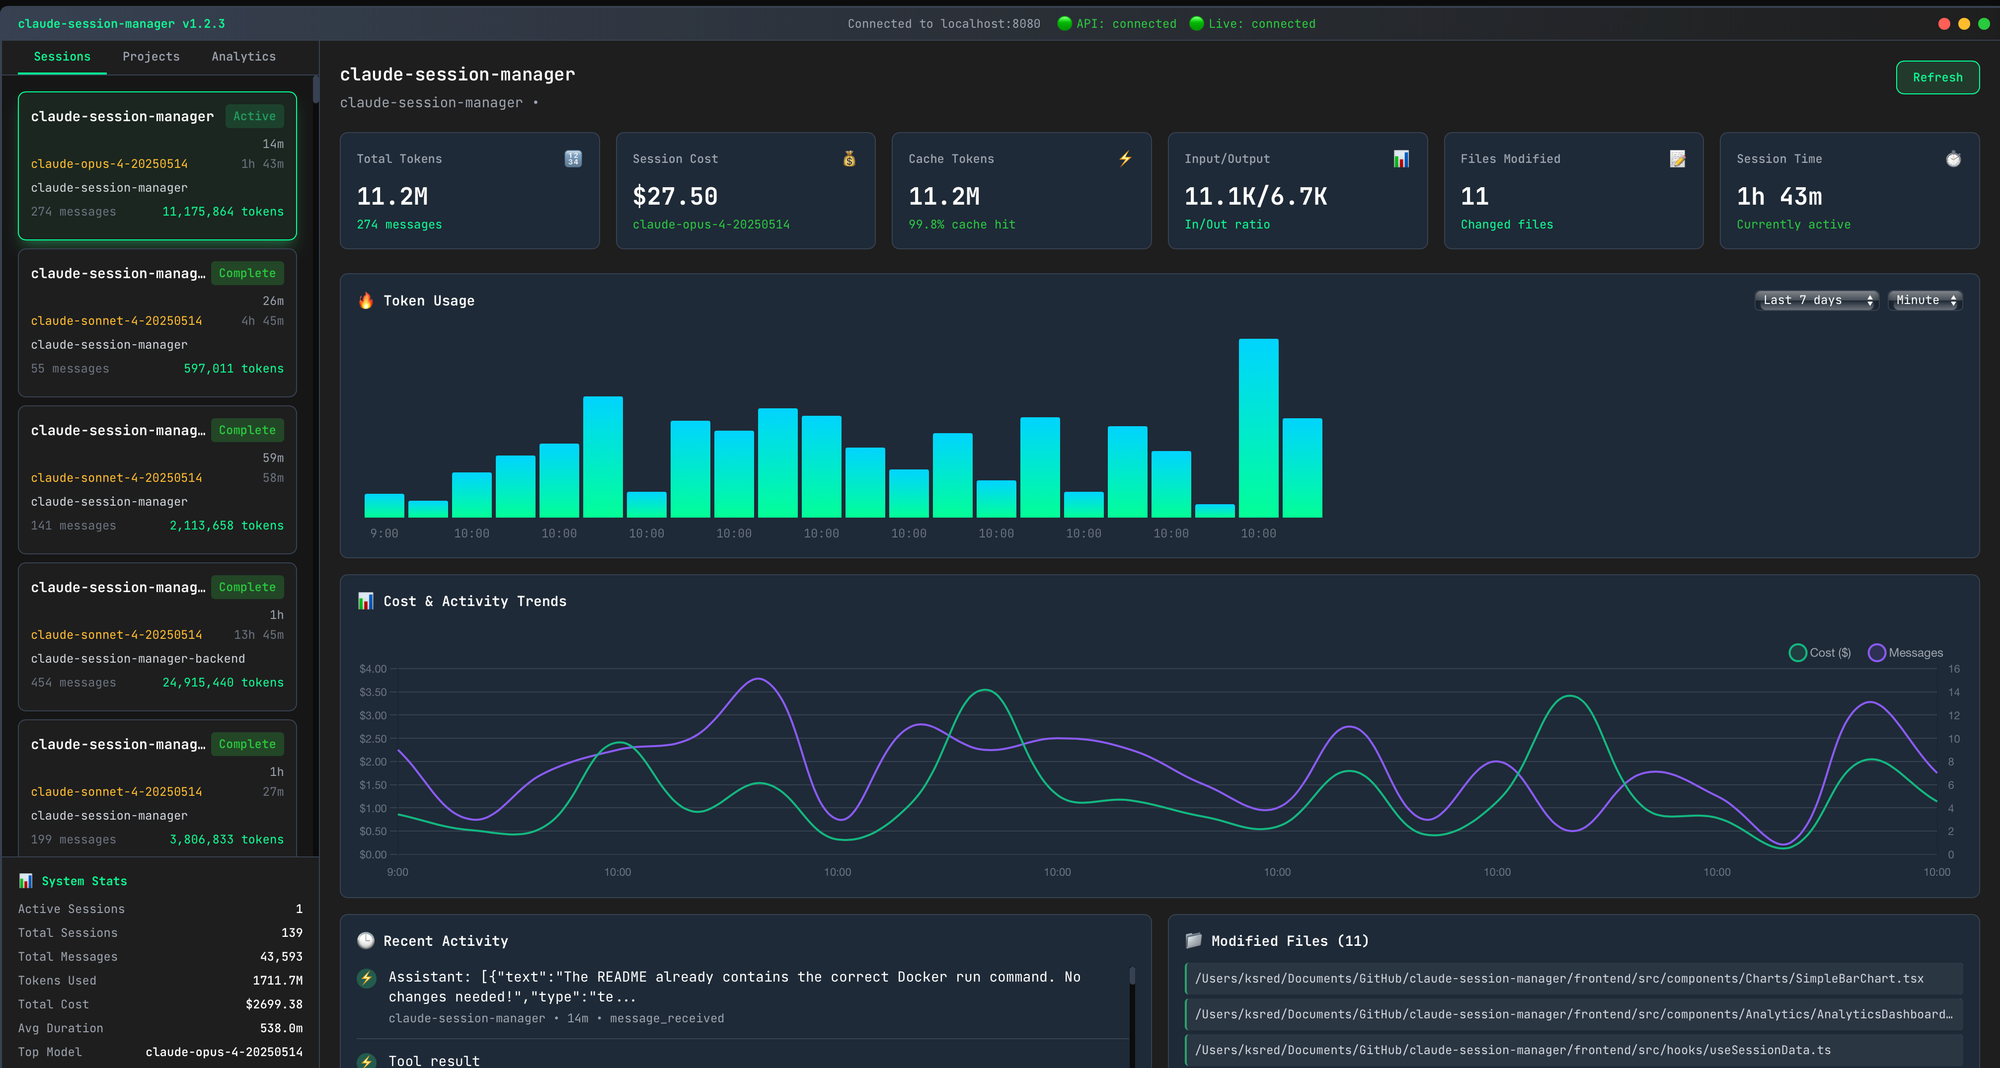
The solution I built is a web-based dashboard that monitors all Claude Code sessions in real-time. It reads session data directly from Claude's local filesystem and presents it through a clean web interface accessible from any browser. The core architecture is straightforward: a Go backend that parses Claude's session files and a React frontend that displays the data with real-time updates via WebSockets.
The technical challenges were more interesting than I initially expected. The main hurdle was parsing all of the session file directories and ensuring that data extraction and storage worked reliably. Claude organises its session data in a fairly complex structure, and I had to reverse-engineer how it stores information about active sessions, token usage, and project context.
The data storage layer uses SQLite, which has its own intricacies. The key insight is that you need to be extremely careful about concurrent writes - SQLite can only handle one writer at a time, so you need to queue up writes using mutexes properly. Otherwise, you get malformed files very quickly, database locks, and the whole program just stops working. This is particularly important in Go applications that make heavy use of goroutines to improve performance, because those concurrent operations can easily overwhelm the database if not managed correctly.
WebSockets, on the other hand, were surprisingly straightforward. I was expecting this to be the tricky part, but it just works. The real-time updates happen seamlessly, and the browser dashboard stays in sync with the actual session state without any polling or complex refresh logic.
The Docker Decision
I ended up packaging everything into a Docker container, which made the deployment story much cleaner. Anyone can pull the image down and mount their ~/.claude directory to get immediate visibility into their sessions. The container is incredibly lightweight because SQLite keeps the data storage simple - I could have used Postgres, but the flat file approach makes the whole thing much more portable.
The Docker approach also solved another problem I've encountered in previous projects: making tools easily shareable. Rather than requiring users to install Go, Node.js, and manage dependencies, they can just run a single Docker command and have the dashboard up and running at localhost. I enjoy building tools that are actually useful to other developers, not just interesting technical exercises.
Surprising Insights from Real Usage
The data revealed some patterns I hadn't expected. Some sessions genuinely last 30+ hours because I'll work on something, leave the session open overnight, and pick it up the next day. These marathon sessions are typically the really tough problems - complex edge cases in a large codebase where the debugging process involves a lot of back-and-forth exploration.
The cost breakdown was particularly surprising. Seeing a single session hit $190 gives you a real appreciation for how much compute is involved in these interactions. Since I'm on the Max plan, I just carry on when I see numbers like that - it's more of an interesting data point than a concern. But it's valuable context for understanding the actual value of the subscription model.
What's been most useful day-to-day is the ability to see at a glance what's actually running. If I have more than three Claude sessions open, I'll leave the dashboard open in a browser tab. It shows me which sessions are actively processing, which directories they're running in, how many files have been changed, and the token usage over time. This eliminates the terminal tab hunting that was eating into my productive time.
The Technical Implementation
The backend is built with Go using the Gin framework, with gorilla/websocket handling the real-time updates. The frontend uses React with TypeScript, built with Vite, and styled with Tailwind CSS. Charts are handled with Chart.js, and the whole thing is responsive so it works well on mobile devices for if I ever deploy this on a server somewhere.
The application watches the ~/.claude directory for changes and updates the SQLite database accordingly. The WebSocket connection pushes updates to any connected browsers, so multiple team members could theoretically monitor the same sessions if they're working on a shared system.
The tool doesn't try to control or modify sessions, just observes and reports. This keeps the implementation simple and reduces the risk of interfering with Claude's own processes.
Looking Forward
I'm planning to open-source this tool soon, but for now, people can pull the Docker image and get immediate value. The container mounts the Claude directory, so you can investigate the SQLite database yourself if you want to build additional tooling on top of it.
The dashboard has already changed how I work with Claude Code. Instead of context switching between terminal tabs trying to remember what's running where, I can see everything at a glance. The cost tracking gives me confidence that the Max plan is providing genuine value, and the real-time monitoring means I can spot long-running sessions that might need attention.
For anyone working with multiple Claude sessions regularly, especially when using Git Work Trees or similar parallel development workflows, having this kind of visibility makes a meaningful difference to productivity. Sometimes the most valuable tools are the ones that eliminate small friction points you didn't even realise were slowing you down.